
Radio advertising ROI is one of the best-kept secrets in media — and one of the worst-told stories.
The medium delivers an average return of $12 for every $1 spent. Nielsen ranks radio advertising ROI second only to social media globally. It reaches 92% of American adults every month. By every objective measure, radio advertising works.
So why do less than half of marketers believe it's effective?
Because most stations can't prove it. Not because the data doesn't exist — it does — but because the industry has done a terrible job translating listener engagement into advertiser outcomes. Sales teams walk into meetings with reach numbers and gut feelings while competing against digital platforms that produce attribution reports at the click of a button.
That gap between reality and perception is costing stations millions in revenue. And it's entirely fixable. (For the full picture of how stations grow revenue across every stream, see our radio revenue guide.)
This guide isn't for advertisers wondering if radio works. It's for station leaders, program directors, and sales managers who know it works and need the framework to prove it. Let's build that case.
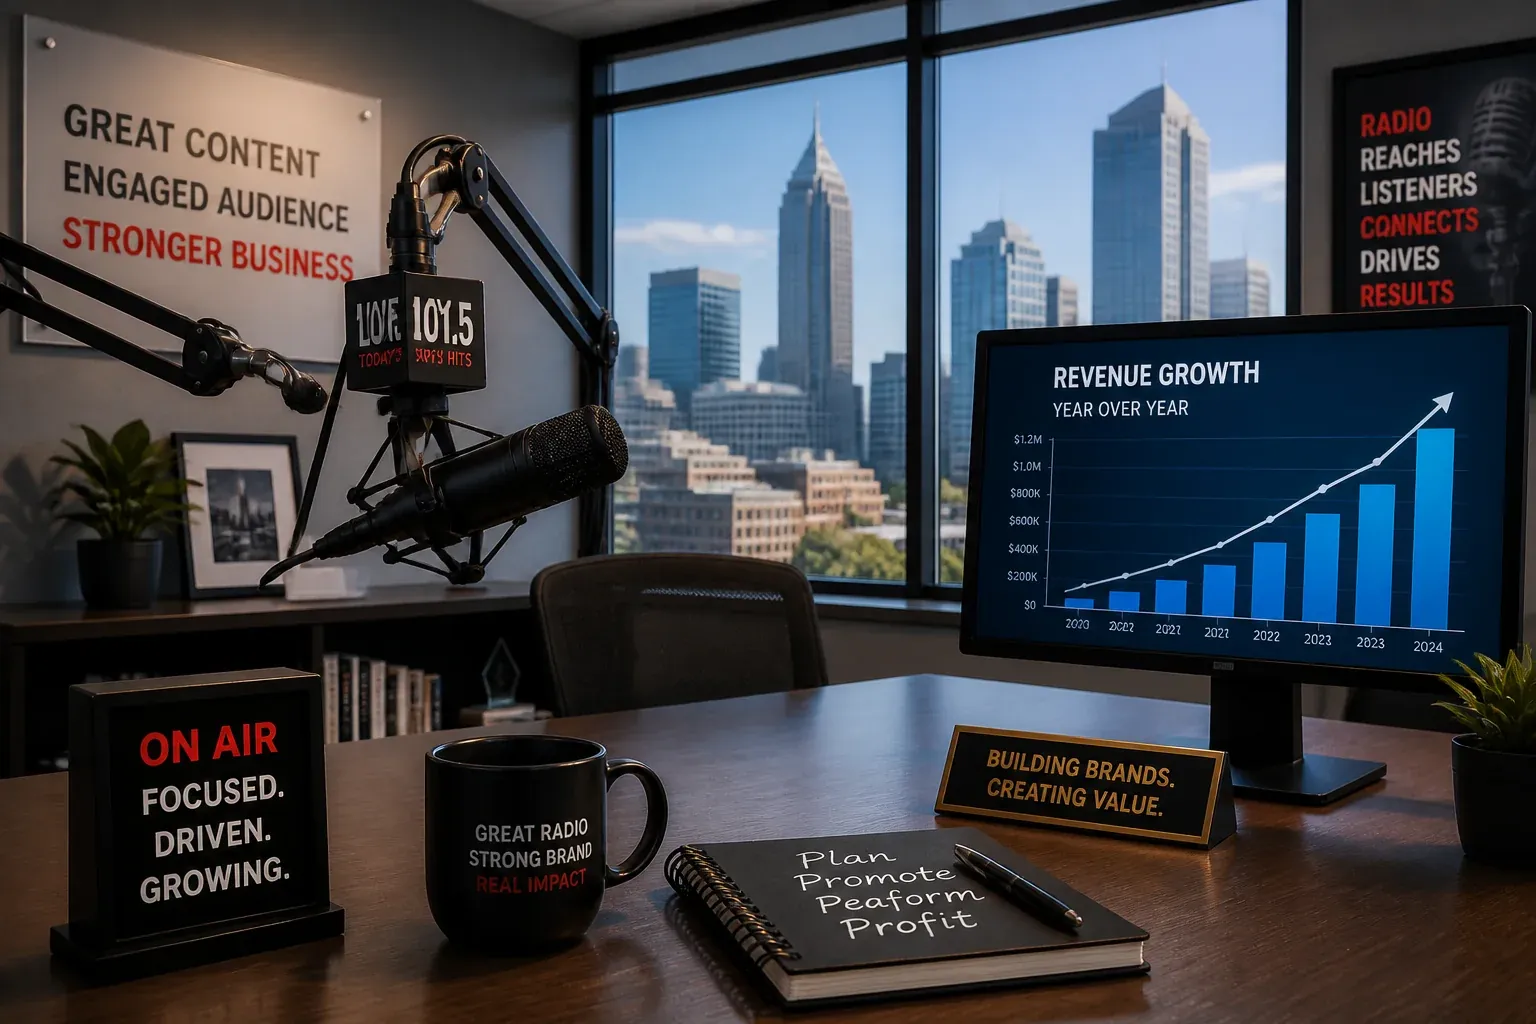
 The perception gap is real: radio delivers top-tier ROI, but most marketers don't believe it.
The Radio ROI Perception Gap
Here's the uncomfortable truth: radio has the data, but the industry doesn't use it well.
Nielsen's Global Compass Benchmarks tell a clear story. Radio delivers a $2 return for every $1 of ad spend — second only to social media at $2.22, and ahead of display ($1.52), search ($1.16), and connected TV ($1.15). For CPG brands specifically, the Westwood One study found that $12:1 figure that gets quoted in every radio sales pitch.
But here's where it falls apart. The average digital media buyer can pull up a dashboard showing impressions, clicks, conversions, and cost-per-acquisition in real time. They can tell you exactly how many people saw an ad, how many clicked, and how many bought something within 30 days.
A radio sales rep? They bring a rate card and an Arbitron book.
That's not a technology problem. It's a presentation problem. The attribution data exists — most stations just aren't collecting it, organizing it, or presenting it in a language that modern media buyers understand.
The stations that close this gap are the ones winning bigger budgets. And it starts with understanding what ROI actually means in radio.
How to Calculate Radio Advertising ROI
Before you can prove value, you need to speak the language. Radio ROI breaks down into two core calculations:
Return on Ad Spend (ROAS) is the simplest and most powerful metric. It divides revenue attributable to radio ads by total ad spend:
ROAS = Revenue from Radio Ads / Total Radio Ad Spend
A ROAS of 3:1 means the advertiser made $3 for every $1 they spent on your station. Anything above 3:1 is generally considered strong performance. The Nielsen benchmark of $12:1 for CPG brands sets the ceiling, but most local campaigns land between 3:1 and 8:1.
Cost Per Acquisition (CPA) measures what it costs to generate a specific outcome — a phone call, store visit, website visit, or purchase:
CPA = Total Ad Spend / Number of Attributed Actions
For radio, CPA benchmarks for businesses spending $10,000+ monthly typically fall between $50 and $200, depending on the market size and product category.
These numbers only work if you can attribute outcomes to radio exposure. That's where the real work begins.
7 Metrics That Prove Radio Advertising Works
Forget vanity metrics. These are the measurements that matter to advertisers — and the ones your sales team should be presenting in every pitch.
1. Web Lift Attribution
This is the closest thing radio has to a "click." Web lift attribution tracks spikes in website traffic during and immediately after a commercial airs.
Tools like Veritone Attribute monitor website traffic in 30-minute windows following each spot. Monthly reporting shows exactly when and how radio commercials drive web visits. If a car dealer's site gets 40 visits per hour on average but spikes to 120 visits in the 30 minutes after their radio spot airs, that's a measurable, repeatable data point.
The key is consistency. One spike is a coincidence. Thirty days of correlated spikes is proof.
2. Call Tracking and Vanity Numbers
Dedicated phone numbers remain one of the most reliable attribution methods in radio. Assign a unique number to each campaign, and you have a direct line between spots aired and calls received.
Modern call tracking goes further — recording call duration, outcomes, and even sentiment. A 30-second call is a hang-up. A four-minute call is a sales conversation. That distinction matters when calculating CPA.
3. Cost Per Thousand (CPM)
CPM measures the cost to reach 1,000 listeners. It's not an ROI metric on its own, but it's the efficiency metric that media buyers compare across channels:
CPM = (Cost of Ad / Total Impressions) x 1,000
Radio's CPM advantage is significant. National averages range from $5 to $20 for radio, compared to $25-$40 for TV and $15-$30 for premium digital display. When an advertiser's budget is fixed, lower CPM means more impressions — and that's a story worth telling.
4. Share of Voice (SOV)
How dominant is your client's ad presence compared to competitors? Share of voice measures the percentage of total advertising in a category that belongs to one advertiser.
A local HVAC company that owns 40% of radio ad inventory in their category has a significant awareness advantage over competitors splitting the remaining 60%. Nielsen data suggests that brands with SOV exceeding their market share tend to grow, while brands with SOV below their market share tend to shrink.
5. Brand Lift and Recall Surveys
Survey-based measurement answers the question: "Do people remember the ad?"
Brand tracking surveys test aided and unaided recall. Aided recall asks "Have you heard a radio ad for [Brand X]?" Unaided asks "Which HVAC companies have you heard advertised on the radio?" The gap between the two tells you how effectively the creative is working.
Pre- and post-campaign surveys can measure shifts in awareness, consideration, and purchase intent. It's more work than digital dashboards, but it answers questions that click-through rates never will.
6. Promo Code and Landing Page Attribution
Simple but effective. Give each radio campaign a unique promo code or landing page URL. "Visit BobsAuto.com/radio" or "Use code MORNING20 at checkout."
This creates a direct, trackable connection between radio exposure and customer action. The conversion data is clean, the attribution is unambiguous, and the numbers are easy to present. Not every listener will use the code — but enough will to establish a measurable baseline.
7. Foot Traffic Attribution
For retail advertisers, foot traffic is the ultimate metric. Location-based attribution platforms can now correlate radio ad exposure with physical store visits.
The methodology: listeners who heard a specific radio campaign are identified through device-level data, then matched against location signals showing store visits during and after the campaign period. The technology isn't perfect, but it's improving rapidly — and it addresses the "last mile" attribution challenge that has historically made radio hard to measure.
Want a personalized walkthrough?
Schedule a 15-minute demo with our team.
The Content-to-ROI Connection Most Stations Miss
Here's where this gets specific to what we do at Radio Content Pro. Most conversations about radio advertising ROI focus entirely on the sales side — better attribution, better presentations, better pitch decks. Those matter. But they miss the biggest lever stations have for improving advertiser outcomes.
Better content drives better ROI. It's that simple — and that overlooked.
The chain works like this: compelling content increases Time Spent Listening. Higher TSL produces stronger ratings. Stronger ratings justify higher ad rates. Higher-quality audiences with longer listening sessions produce better outcomes for advertisers. Better outcomes produce higher ROI.
Every link in that chain is measurable. And the first link — the content — is the one stations have the most control over.
Consider the math. If your morning show adds just one extra listening occasion per day — someone who tunes in for the drive to work now also checks in during lunch — your AQH can jump by up to 50%. That's not a marginal improvement. That's a rate card increase. That's a stronger pitch to every advertiser on your roster.
The stations I work with that have the strongest advertiser relationships aren't just the ones with the best sales teams. They're the ones with the most loyal listeners. Advertisers can feel the difference between a station where listeners are tuning in out of habit and one where they're genuinely engaged. Engaged listeners act on what they hear. Disengaged listeners let it wash over them.
That's why show prep isn't just a programming expense — it's a sales asset.
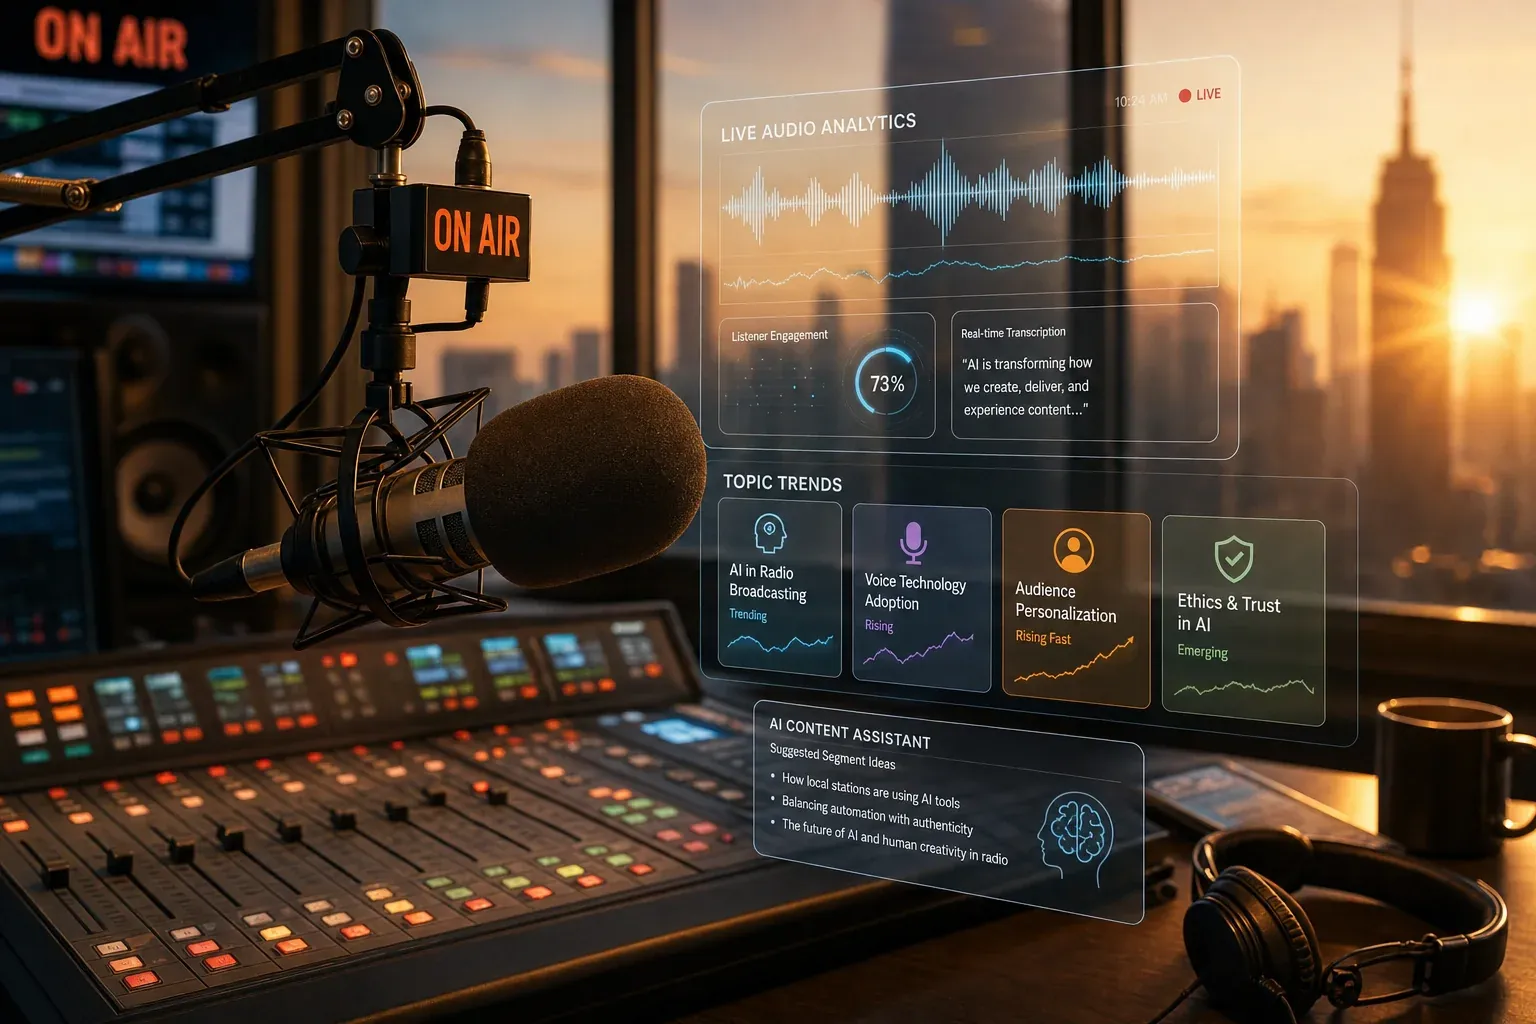
 The content-to-ROI chain: better programming drives every link from TSL to advertiser outcomes.
Building Your Station's ROI Framework
Theory doesn't close deals. Your sales team needs a practical, repeatable system for documenting and presenting ROI data. Here's the framework I recommend:
Step 1: Set SMART Goals Before Every Campaign
Every campaign should start with specific, measurable goals agreed upon with the advertiser. Not "increase awareness" — that's not measurable. Try:
- "Drive 200 unique visits to BobsAuto.com/radio within 30 days"
- "Generate 50 inbound calls using the dedicated tracking number"
- "Achieve 15% aided brand recall in post-campaign survey"
The goals define success before a single spot airs. When results come in, both sides know exactly how to evaluate them.
Step 2: Implement Attribution from Day One
Don't wait until the campaign ends to figure out measurement. Set up tracking before the first spot runs:
- Web lift tracking — Activate attribution tools tied to the advertiser's website
- Call tracking — Assign dedicated numbers and configure call analytics
- Promo codes — Create unique codes and brief the advertiser's team
- Baseline metrics — Document pre-campaign numbers for comparison
Step 3: Report Weekly, Not Just Post-Campaign
Real-time reporting changes the conversation. Instead of a post-campaign recap three weeks after the flight ends, send weekly performance snapshots.
A simple format works: spots aired, web lift events, calls tracked, codes redeemed. Include a brief narrative — "Week 2 saw a 34% increase in web traffic following the new creative rotation." This keeps the advertiser engaged and builds confidence before the invoice arrives.
Step 4: Build Case Studies from Every Win
Every successful campaign becomes a sales tool for the next one. Document the results, get permission to share them (anonymized if needed), and build a library of proof points.
"A local restaurant chain saw a 4.2:1 ROAS over 90 days using morning drive inventory" is infinitely more persuasive than "radio reaches 92% of adults." Generic stats open doors. Specific case studies close deals.
Step 5: Present Data in the Advertiser's Language
This is where most stations fail. They present radio data in radio terms — AQH, cume, TSL. Advertisers don't care about those metrics. They care about sales, leads, and cost-per-customer.
Translate everything:
- AQH becomes "average audience at any given moment"
- Cume becomes "total unique reach"
- TSL becomes "average engagement time per listener"
- ROAS stays ROAS — that one they already understand
Radio vs. Digital: The ROI Comparison Advertisers Need
Your competitors aren't other radio stations. They're Google, Facebook, and programmatic display. Here's how to win that comparison honestly.
| Metric | Radio | Digital Display | Social Media | Search |
|---|---|---|---|---|
| Average ROAS | $2.00 | $1.52 | $2.22 | $1.16 |
| CPM | $5-$20 | $15-$30 | $8-$25 | N/A (CPC model) |
| Monthly Reach | 92% of US adults | ~70% (varies) | ~80% | ~90% |
| Trust Factor | High (local, familiar) | Low (ad blindness) | Medium | Medium |
| Attribution Ease | Medium (improving) | High | High | High |
Sources: Nielsen Global Compass Benchmarks, RAB, industry averages
Radio's ROAS is competitive with or better than most digital channels. The gap is in attribution ease — and that's closing fast with modern tools. The honest pitch isn't "radio is better than digital." It's "radio is the highest-ROI channel you're probably underinvesting in, and here's the data to prove it."
The smartest media plans aren't either/or. Nielsen's Commspoint data shows that adding AM/FM radio to digital-only plans increases total reach from 33% to 74% of the U.S. population. Radio doesn't replace digital — it supercharges it.
The 2026 Radio Advertising Landscape
The radio industry trends for 2026 point to three developments that directly affect advertising ROI:
AI-powered attribution is getting better fast. Platforms like Veritone and Spotwise now offer near-real-time correlation between ad airings and web traffic. The 90-day attribution windows that seemed futuristic two years ago are becoming standard. For stations, this means the measurement gap with digital is shrinking every quarter.
Podcast and streaming audio aren't the threat — they're the opportunity. AM/FM still commands 64% of ad-supported audio listening, with podcasts at 20%. But the real win is cross-platform packaging. Stations that bundle terrestrial spots with streaming, podcast, and digital inventory are selling integrated audio campaigns — and those campaigns produce higher combined ROI than any single channel alone.
The advertiser perception gap is closing. As more stations adopt modern attribution tools and present data-driven ROI reports, the "radio can't be measured" objection is losing its power. The stations doing this well are winning budget share from digital. The ones still presenting reach-and-frequency decks are losing it.
Common ROI Objections (and How to Handle Them)
Your sales team will hear these. Here's how to respond with data:
"We can't track radio like we track digital." Response: "Actually, you can. We use web lift attribution that tracks site visits within 30 minutes of each spot. We also assign dedicated phone numbers and promo codes. Want to see last month's attribution report for [similar advertiser]?"
"Radio's audience is declining." Response: "Radio reaches 92% of US adults monthly — more than any other medium including TV and digital. What's declining is time spent per occasion, which is why we focus on high-engagement programming that keeps listeners tuned in longer."
"Our budget is all digital now." Response: "Nielsen shows that adding radio to digital-only plans nearly doubles total reach — from 33% to 74%. Radio isn't competing with your digital budget. It's the multiplier that makes your digital spend work harder."
"What kind of ROAS can we expect?" Response: "For businesses investing $10K+ monthly in our market, typical ROAS falls between 3:1 and 8:1. The Nielsen benchmark across all radio is $12:1 for CPG. We set specific goals upfront and report against them weekly — so you'll know exactly what you're getting."
Making Your Station More Valuable to Advertisers
Proving ROI isn't just about measurement — it's about actually delivering results worth measuring. Here's the programming side of the equation:
Invest in show prep that produces engaged listeners. Pre-prepared, professionally curated content gives your talent more time for the high-value work: local stories, audience interaction, and the personality-driven moments that create emotional connection. When your team applies the 80/20 rule to content creation, they spend less time on research busywork and more time on the segments that actually move ratings. Engaged listeners respond to ads. Background listeners don't.
Audit your content with the same rigor you audit your spots. You wouldn't run a client's commercial without quality control. Apply the same standard to your programming. Every segment that fails to engage is a missed impression for your advertisers.
Build content that attracts the demographics advertisers want. If your highest-value advertisers target adults 25-54, your content should specifically serve that demo. That means knowing what topics drive engagement with that audience — not guessing, but actually tracking which segments produce the highest TSL with your target listeners.
Create sponsorable moments, not just ad inventory. "The Morning Show Weather Update, brought to you by..." is worth more than a :30 spot in a commercial cluster. Content integration produces higher recall, higher engagement, and higher ROI for the advertiser — which means higher rates for you.
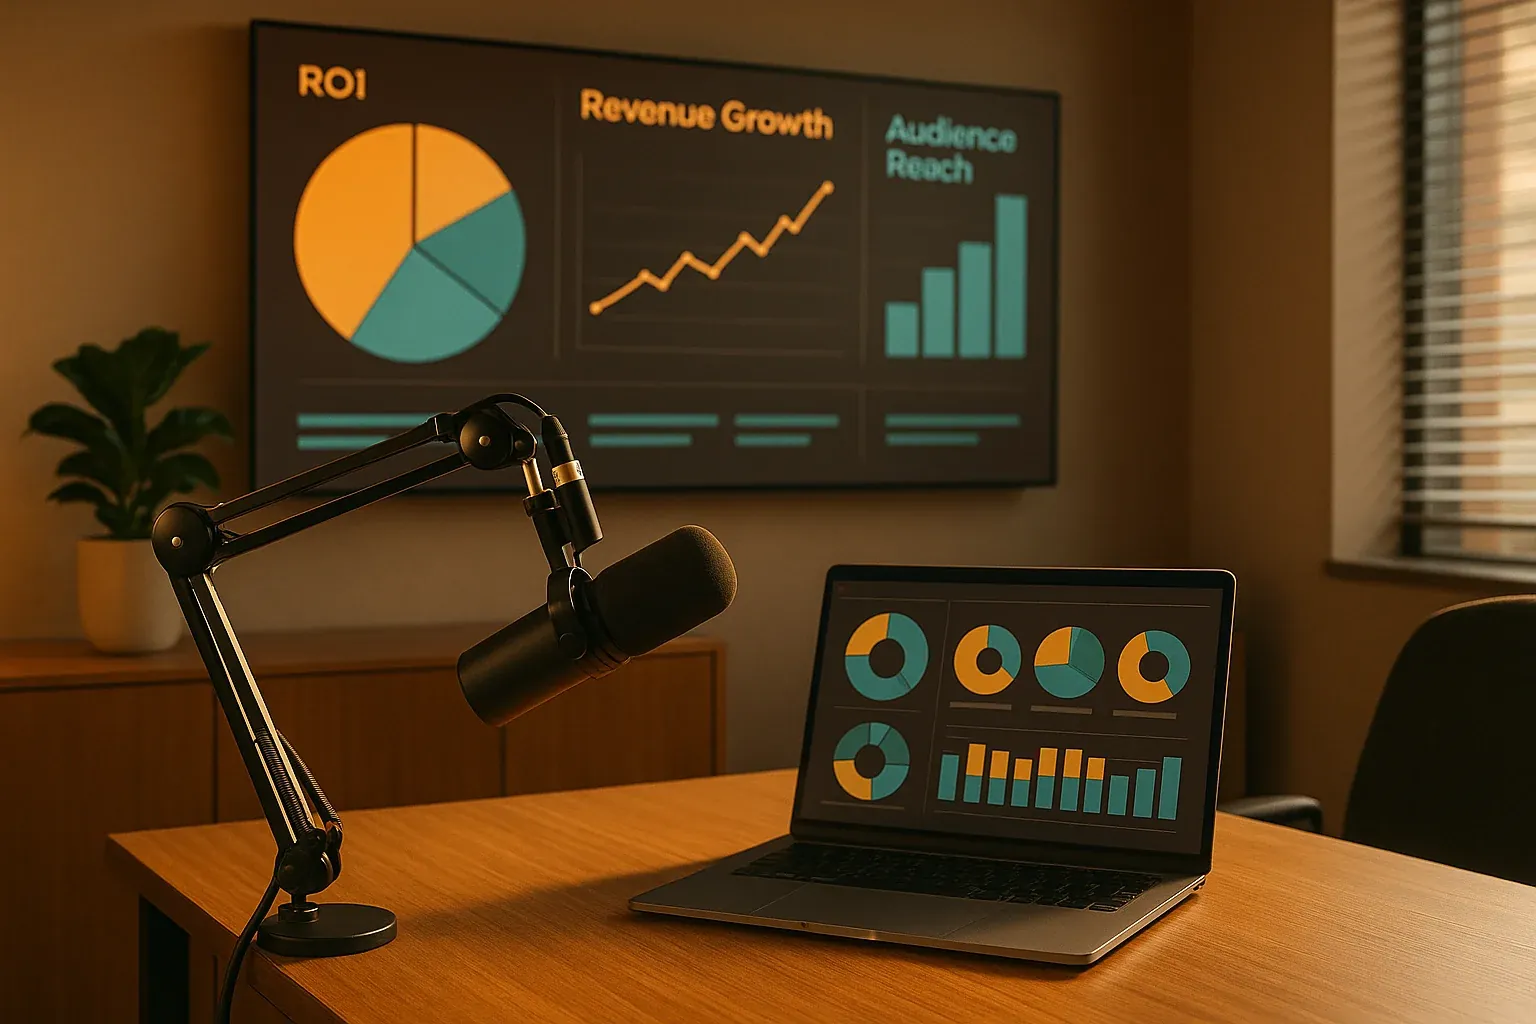
 Stations that present data in the advertiser's language win bigger budgets.
Your 30-Day ROI Action Plan
Don't try to build Rome in a week. Here's a realistic timeline for implementing an ROI framework at your station:
Week 1: Audit and Baseline
- Document current attribution capabilities (what are you tracking today?)
- Identify your top 10 advertisers by revenue
- Pull baseline web traffic, call volume, and survey data for each
- Interview your sales team: what objections are they hearing most? What data do they wish they had?
- Review competitor stations' media kits — how are they presenting their value?
Week 2: Tool Setup
- Implement web lift attribution for your top 5 advertisers
- Set up dedicated call tracking numbers for each active campaign
- Create standard promo code and landing page templates
- Build a simple reporting dashboard (even a Google Sheet works for v1)
- Test every tracking mechanism end-to-end before going live with advertisers
Week 3: Sales Training
- Train sales team on the ROI framework and new metrics
- Role-play the four common objections with data-backed responses
- Build the first version of your comparison dashboard
- Draft your station's value proposition using real data, not industry averages
- Create a one-page "ROI Toolkit" cheat sheet for the sales team to bring to meetings
Week 4: Launch and Iterate
- Begin weekly reporting for pilot advertisers
- Collect feedback and refine the presentation format
- Start building your case study library from early results
- Schedule quarterly ROI reviews with your top 5 accounts
- Set a 90-day check-in to evaluate which attribution methods are producing the best data
The stations that commit to this process see results within the first quarter. Not because the tools are magical — they aren't. But because the shift from "trust us, radio works" to "here's exactly how it worked for your last campaign" changes the conversation entirely. Advertisers stop seeing radio as a gamble and start seeing it as an investment with documented returns.
Frequently Asked Questions
How do you calculate ROI on radio advertising?
The most common method is Return on Ad Spend (ROAS): divide total revenue attributable to radio ads by total radio ad spend. For example, if a campaign costs $5,000 and generates $25,000 in trackable sales, the ROAS is 5:1. Attribution methods include web lift tracking, call tracking, promo codes, and foot traffic analysis.
Is radio advertising still effective in 2026?
Yes. Nielsen data shows radio delivers the second-highest ROI among all media channels, returning $2 for every $1 spent. Radio reaches 92% of US adults monthly and maintains the highest monthly reach of any media platform among adults 18+. The challenge isn't effectiveness — it's measurement and attribution, which modern tools are rapidly solving.
What is a good ROAS for radio advertising?
A ROAS above 3:1 is generally considered strong for local radio campaigns. Nielsen benchmarks show an average of $12:1 for CPG brands and $2:1 across all categories. For businesses spending $10,000+ monthly, typical ROAS ranges from 3:1 to 8:1, with a standard attribution window of 7-14 days.
How does radio advertising ROI compare to digital?
Nielsen Global Compass Benchmarks rank radio ($2 ROAS) second only to social media ($2.22), ahead of display ($1.52), search ($1.16), and connected TV ($1.15). Radio also offers significantly lower CPMs — typically $5-$20 compared to $15-$30 for digital display. Adding radio to digital-only plans increases total campaign reach from 33% to 74%.
What tools can radio stations use to measure advertising ROI?
Key attribution tools include Veritone Attribute (web lift tracking), dedicated call tracking platforms, promo code systems, brand tracking survey platforms, and foot traffic attribution services. Modern solutions can track conversions for up to 90 days after ad exposure and correlate spots with web traffic in near-real time.
Want a personalized walkthrough?
Schedule a 15-minute demo with our team.
Radio advertising isn't dying. It's being undersold. The stations that arm their sales teams with real ROI data — backed by great content that keeps listeners engaged — are the ones winning budgets in 2026. The data is on your side. Start using it.